Land Use Mapping and Report
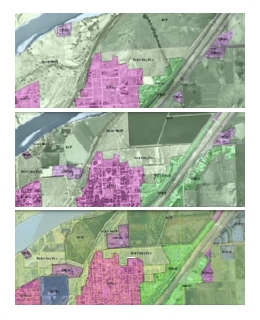 The land use mapping effort consisted of digitizing land use polygons using 1948-1950's, 1976-1977, 1999-2001, and 2012 aerial imagery in a GIS environment. The goal of the delineation was to capture areas of similar land use as they appeared on the aerial imagery, while maintaining a consistent scale. Four tiers of nested attributes were developed for the mapping effort. The study area is defined by the GIS-modeled 100-year inundation boundary, plus a 500-meter buffer. In total, over 700 square miles of area were mapped for each suite of imagery.
Land Use GIS Data . These data consist of land use polygons digitized from 1948-1950's, 1976-1977, 1999-2001, and 2012 aerial orthophotographs.
Yellowstone River Land Use Mapping and Analysis Final Report (January 2013)
Yellowstone Clearinghouse Home
Yellowstone River Final Reports
- Cumulative Effects Analysis (CEA)
- CEA Technical Appendices
- CEA Executive Summary
- Reach Narratives
- Recommended Practices and Position Statements
- Governor's Upper Yellowstone Task Force (1997-2003)
Maps
- Online Map Viewer
- Reach Story Map 1: Overview
- Reach Story Map 2: Details
- Yellowstone Reference Maps
- Maps Selected from Technical Reports
Data and Technical Reports
- Imagery and Topographic Mapping
- Hydrology and Hydraulics
- Land Use and Physical Features
- Geomorphology
- Biology
- Socioeconomics
- List of Available GIS Data
Contact Info